

Console Tour
A short orientation to the ShieldedStack console: what each page is for, and which document covers it in depth.
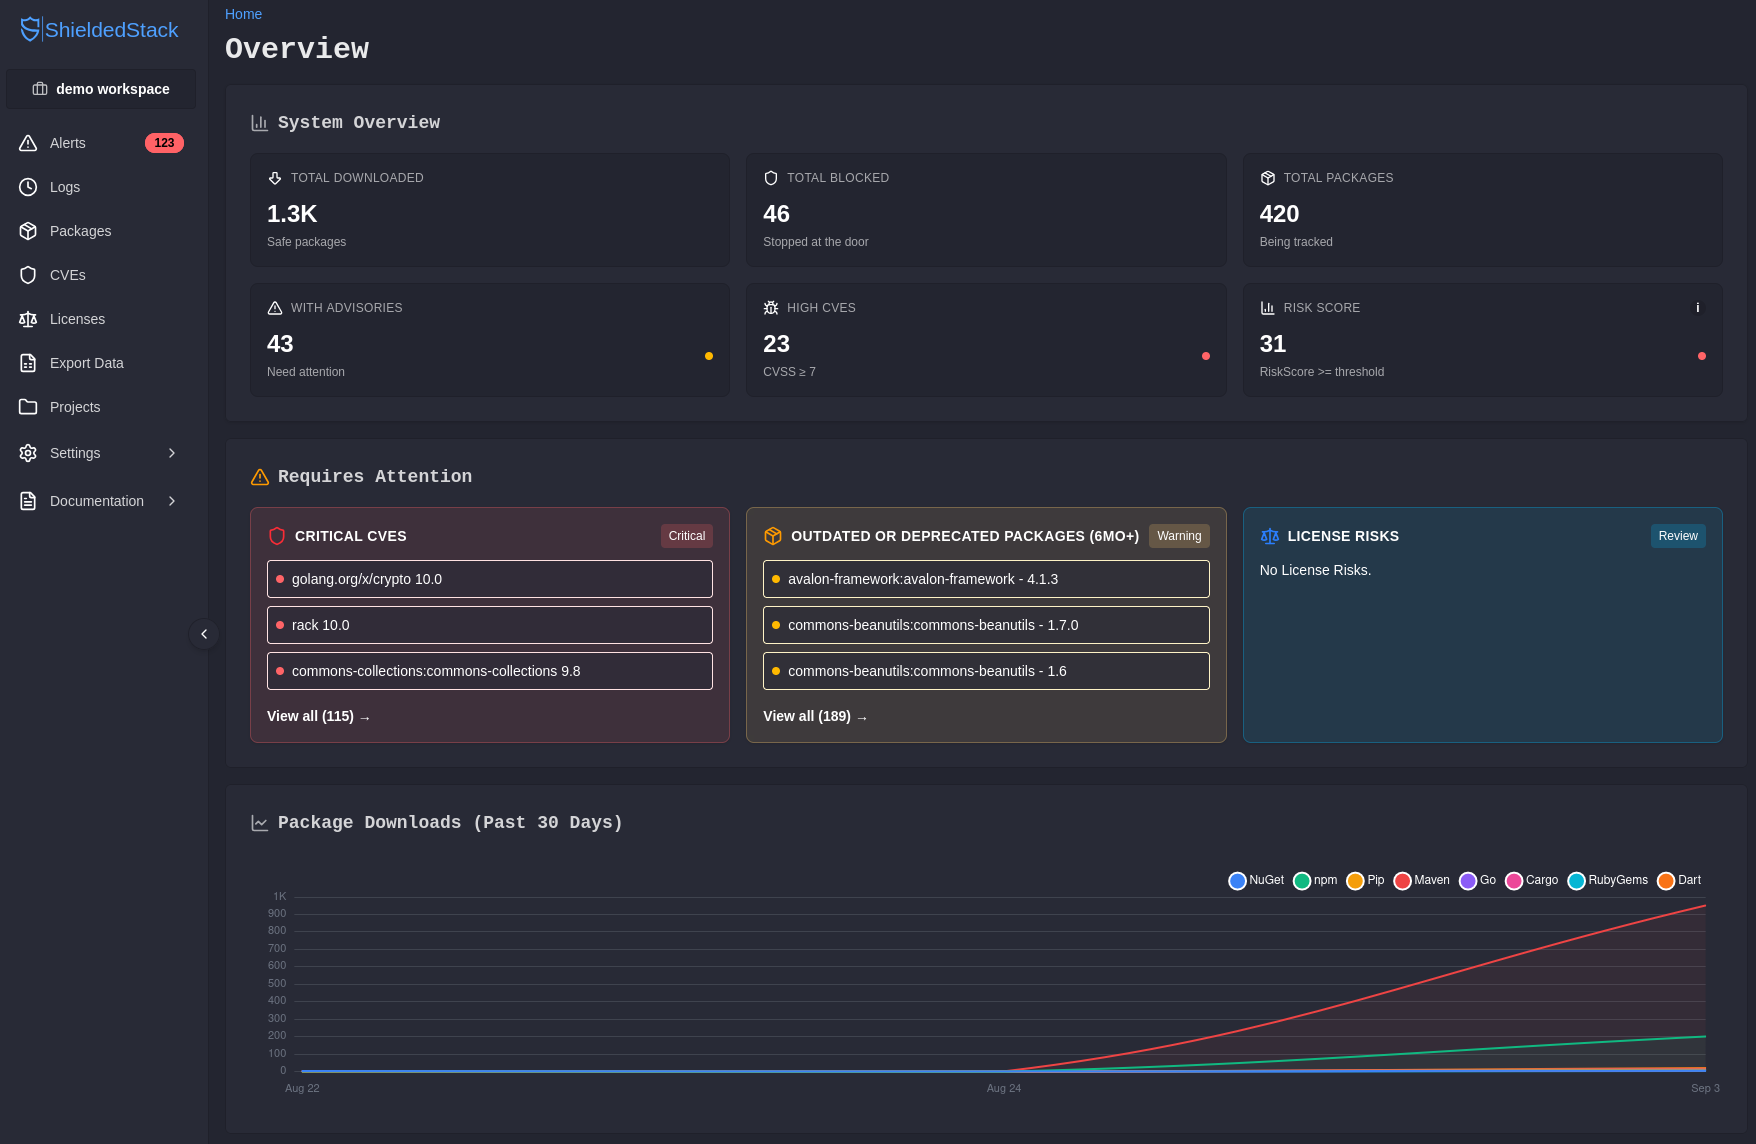
Overview
Section titled “Overview”Overview is the page you land on. It answers “is anything wrong right now” without requiring you to go looking.
System Overview carries four tiles: total packages being tracked, how many have advisories against them, how many carry high-severity CVEs, and how many exceed the risk threshold.
Requires Attention is the triage shortlist. Critical CVEs, packages that are outdated or deprecated by six months or more, and license risks each get a card listing the first few entries with a link through to the full view. If these cards are empty, the workspace genuinely has nothing waiting.
Package Downloads plots install activity over the past 30 days, broken down by ecosystem. It is the fastest way to notice that a pipeline has stopped routing through the proxy, because the traffic you expect simply is not there.
Navigation
Section titled “Navigation”The sidebar is ordered roughly by how often you need each page.
| Page | What it is for | Read more |
|---|---|---|
| Alerts | The triage queue: vulnerabilities and license changes affecting versions you use | Alerts and Triage |
| Logs | Every proxy request, allowed and blocked, with its reason | Request Logs and Traceability |
| Packages | The inventory, with risk scores, versions, and per-package detail | Packages and Risk |
| CVEs | Security advisories affecting the workspace | Packages and Risk |
| Licenses | Licenses in use, with risk classification | Packages and Risk |
| Export Data | CSV, JSON, and CycloneDX/SPDX SBOM exports | Exports and SBOM |
| Projects | Tracked projects and their descriptions and metadata | Workspaces, Projects and Access |
| Settings | Policy, API keys, filters, exceptions, channels, members | Policy and Enforcement |
| Documentation | These documents, inside the portal |
Settings expands into its own sections: API Keys, Package Filters, Vulnerability Exceptions, Notification Channels, and Members. The Settings landing page itself holds workspace policy: allow and deny list behaviour, minimum block level, running mode, grace period, and alert cooldown.
The Workspace Selector
Section titled “The Workspace Selector”At the top of the sidebar is the current workspace. Everything below it is scoped to that workspace: its alerts, its inventory, its policy, its keys, its history.
This is the single most important control in the console to be aware of, because every page will happily show you correct information about the wrong environment. When a number does not match what you expect, check the workspace before anything else.
Workspaces are created and renamed from this selector, by members with the Manage workspaces permission.
Working With Tables
Section titled “Working With Tables”The data views share the same behaviour, so learning one teaches you the rest.
- Filters persist as you navigate. A project filter set on Packages is still applied when you come back to it. This is convenient until it is confusing, so Clear Filters is worth reaching for when a view looks emptier than it should.
- Columns are adjustable on the larger tables, and on Packages a chosen set can be saved as a named view alongside the built-in ones.
- Rows open detail. Selecting a package, alert, or log entry opens the full record rather than truncating it in the table.
- Export takes the current view. Where an export control is present, it exports what you are looking at, filters and columns included.
- Auto-refresh is available on Alerts and Logs. Turn it on while watching a rollout or working an incident, and off the rest of the time.
Personal Settings
Section titled “Personal Settings”User Settings, reached from the bottom of the sidebar, holds preferences that apply to you rather than to the workspace:
- Alert count badge: whether vulnerability alerts, license change alerts, or both are counted in the sidebar badge. This changes the badge only. Alerts themselves remain on the Alerts page regardless.
- Appearance: light or dark theme for this browser.
Nothing here affects policy, other members, or what anyone else sees.