

Request Logs and Traceability
Vulnerabilities are usually disclosed after the package has already been installed, sometimes months after. The question at that moment is not whether the package is bad. It is where did it go — which pipelines pulled it, into which environments, on whose behalf, and does any of that still exist.
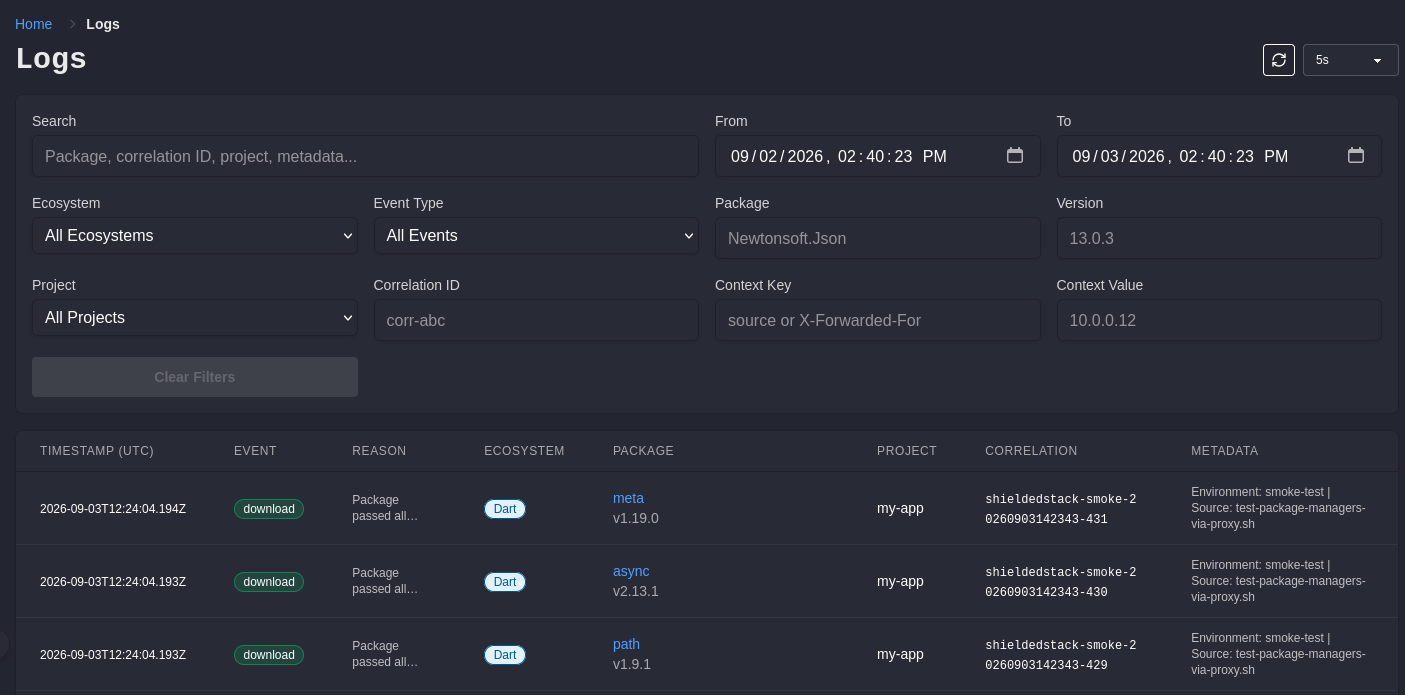
The Logs page answers that. Every blocked request is recorded, and so is every allowed request the proxy served or redirected to, with the decision and the reason for it. An allowed request that ended without delivering the package, for example because that version does not exist upstream, is not recorded.
What Is Recorded
Section titled “What Is Recorded”| Field | What it tells you |
|---|---|
| Timestamp | When the request was handled |
| Event type | Whether the package was downloaded or blocked |
| Ecosystem, package, version | Exactly what was requested |
| Project | The project the API key is bound to |
| Rule | Which policy rule decided the request, such as a deny list match, a denied license, or the vulnerability threshold |
| Decision reason | Why the request was allowed or blocked, in the policy’s own words |
| Correlation ID | An identifier that ties together every request from one build or job |
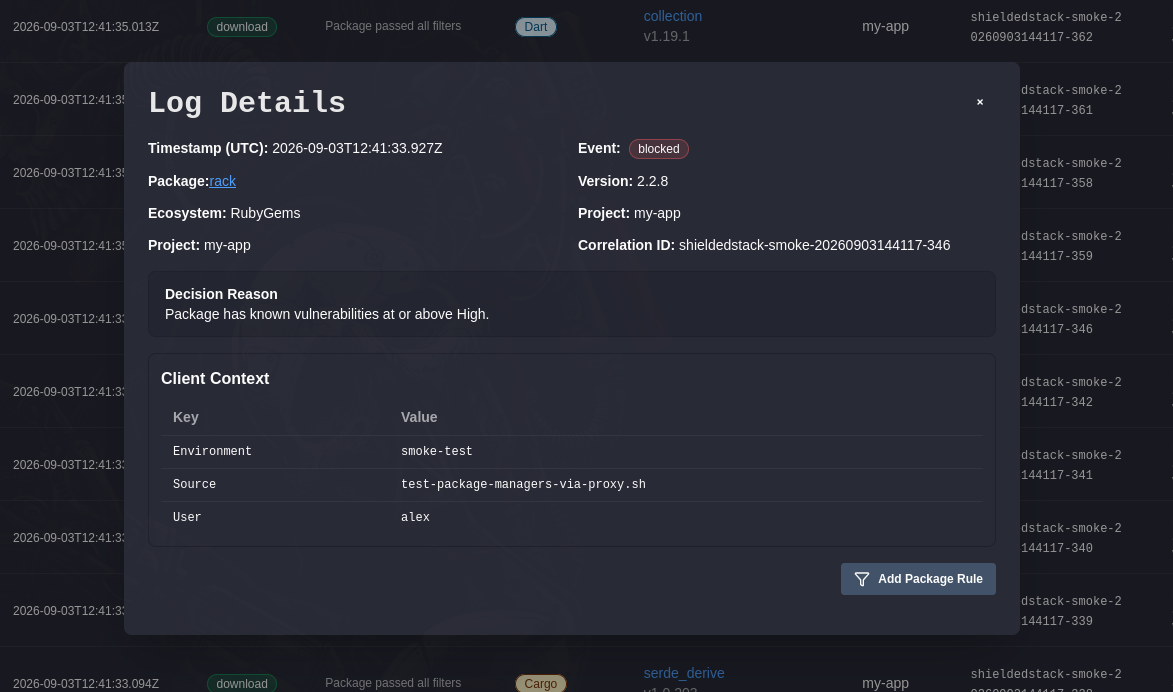
| Client context | Trusted metadata about where the request came from |
Selecting any row opens the full record, including the complete client context.
Filtering
Section titled “Filtering”Filters are built for narrowing an investigation rather than browsing:
- Search across package, correlation ID, project, and metadata.
- From and To for the window you care about.
- Ecosystem, Event type, Rule, Package, Version, and Project.
- Correlation ID to pull up every request from one build.
- Context key and Context value to select by where a request came from, such as every request from one CI runner or one environment.
Set an auto-refresh interval when you are watching traffic live, for example while rolling out a policy change and confirming that nothing legitimate is being blocked.
Decisions and the Policy Behind Them
Section titled “Decisions and the Policy Behind Them”The Rule on each event names the part of the policy that decided it. When that was an allow or deny rule, the event also records exactly which one: the detail panel shows the Matched Rule as it stood when the decision was made. Rules are kept after they are removed or edited, so this works for events of any age recorded since matched rules were stored. When vulnerability exceptions are why a package was allowed, the decision reason names the accepted advisories.
The rule also makes events easy to slice. Filtering by rule answers questions such as “what did the license policy block last quarter” directly, without reading reasons row by row. Events recorded before the rule was stored show it as not recorded.
To hand the decisions for a period to someone outside the console, use the Decisions export. See Exports and SBOM.
Retention
Section titled “Retention”Events are kept indefinitely unless your deployment sets a limit. Retention is a deployment setting, PackageEventContextLog__RetentionDays: -1 keeps every event, and a positive number deletes events older than that many days. Other values are rejected at startup.
Because ShieldedStack runs in your environment, the events live in your database. With no limit set, that table grows for as long as the proxy is in use, so size the database accordingly or set a period that matches your record-keeping obligations. Events are only as durable as your database backups.
Client Context
Section titled “Client Context”The proxy sees the request, but it does not inherently know that the request came from the nightly build of a particular service on a particular runner. Client context is how that information gets attached.
Anything in the request path can add it: a CI job, an ingress controller, a service mesh, an internal gateway, or a package manager that supports custom headers. ShieldedStack records these headers by default:
| Header | Use it for |
|---|---|
ShieldedStack-Source |
What issued the request, such as a runner pool, agent, or gateway name |
ShieldedStack-Environment |
Which environment it belongs to, such as staging or production |
ShieldedStack-User |
The service account or user the job runs as |
X-Forwarded-For |
The client address as seen by your ingress |
Two things are worth understanding about this list.
First, it is a deployment setting, not a per-user one. Which headers are trusted and recorded is configured when ShieldedStack is deployed, and the list can be extended with headers already in use. Headers outside that list are ignored rather than recorded, so an arbitrary client cannot stuff the audit trail with fields of its own invention.
Second, the value is only as trustworthy as the hop that set it. Context added by your ingress or your CI platform is evidence. Context added by whatever was running on the developer laptop is a self-declaration. Where this distinction matters, have the trusted hop set the header and strip any inbound copy.
Correlation IDs
Section titled “Correlation IDs”If a request carries an X-Request-Id header, ShieldedStack records it as the correlation ID. If it does not, one is generated for the request.
Setting it per build is a small change with a large payoff: every package that one pipeline run pulled shares an identifier, so you can reconstruct the full dependency set of a single build from the log rather than inferring it from timestamps. Most CI systems already expose a build or run identifier that can be passed straight through.
Working an Incident
Section titled “Working an Incident”An advisory lands for a version you allowed three months ago. A workable sequence:
- Establish exposure. Filter by package and version with no date bound. If there are no rows, the version never came through this workspace.
- Bound the window. The earliest and latest timestamps tell you how long the exposure ran, which usually decides whether this is a rebuild or an investigation.
- Identify the projects. The project column names the API keys, and therefore the repositories and pipelines, that pulled it.
- Narrow to environments. Filter by context key and value to separate a version that only ever reached a development sandbox from one that reached a production release pipeline.
- Reconstruct individual builds. Take a correlation ID from any row and filter on it to see everything that build pulled alongside the affected package.
- Stop the bleeding. Add a deny filter for the affected version, or lower the block level, then watch the log with auto-refresh on to confirm new attempts are being blocked. See Policy and Enforcement.
Steps 1 through 4 are also the fastest honest answer to “were we affected”, which is a question that tends to arrive from outside engineering and with a deadline attached.
Blocked Requests
Section titled “Blocked Requests”Blocked events are worth reviewing on their own, not only during incidents. Each carries the reason the policy gave, which separates the three cases that look identical from a failing build:
- a package that is genuinely denied,
- a version that is merely too new and will pass once the grace period elapses, and
- a request that could not be verified in Verify then Trust mode.
Filtering to blocked events after a policy change is the quickest way to see whether a new rule is doing what you intended or quietly breaking a team’s build. A developer reporting a failed install can usually be answered in one lookup: filter by their project and package, and read the reason.